Toby Perkins MP Standing up for Chesterfield and Staveley
Over the summer recess, I have been running a Brexit survey across the Chesterfield constituency. I am now in a position to publish the responses that I received and give you my summary of what the answers tell us about Chesterfield’s people’s views.
Who completed the survey?
The survey was available online and was promoted both on my Facebook and Twitters accounts and via the Derbyshire Times. We also took the survey onto the streets and invited some Chesterfield constituents to respond to the survey asked by campaigners from the Labour Party. In total we had 1,279 responses from within the Chesterfield constituency.
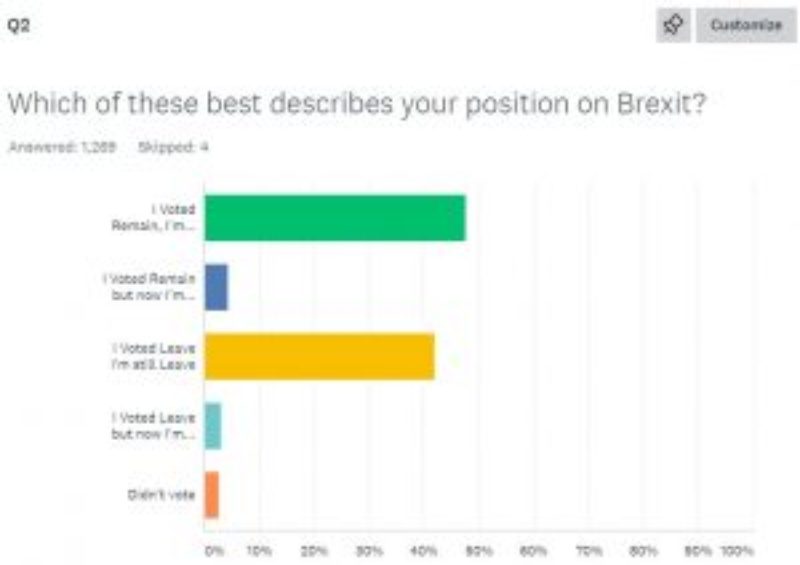
The first question sought to establish what proportion of respondents had originally voted Remain or Leave and whether there had been significant movement in people’s views since the Referendum.
In response to this 47.82% said they had voted Remain and were still in favour of Remain, and 41.86% said they’d voted Leave and were still in favour of leaving. In addition 2.69% hadn’t voted. This meant that a very small percentage (7.58%) had changed their minds, with slightly more having favoured Remain now being Leave than the other way round.
The Chesterfield constituency is not exactly the same as the Chesterfield Borough area, but an estimated 58% of Chesterfield constituents voted to Leave the EU- this means that either there has been a considerable change of heart since then or that the respondents to my survey contained a disproportionately high number of remain voters. Given that less than 8% said that they had changed their mind, I expect that it was the latter.
What should happen now?
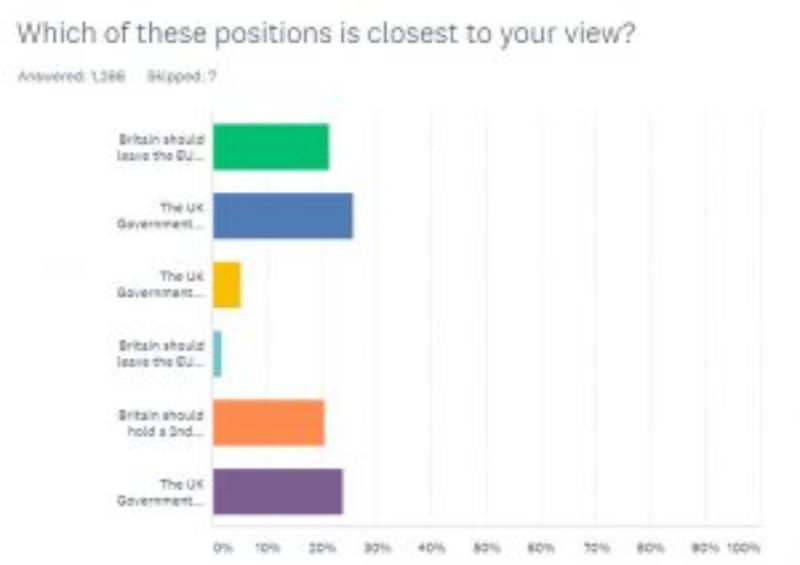
On the question of what should happen next, there was almost an exact split between the three ‘remain’ options and the three ‘leave’ options, but with a vast majority at the more extreme aspects of the answers.
Of the ‘remain’ options, 23% thought the UK Government should revoke Article 50 and remain in the EU, 20.6% thought that the Government should hold a 2nd Referendum to decide whether to leave or remain, and only 5.3% thought Britain should attempt to negotiate a new deal but Remain if no better deal could be resolved.
Of the ‘leave’ options, 21% argued for leaving the EU on WTO terms and 25.65% thought that Britain should attempt to negotiate a new deal but be prepared to leave without one if unable to do so. Just 1.5% were in favour of supporting Theresa May’s deal and then reviewing after the 2-year transition period.
Sadly, these responses merely go to demonstrate how divided we are as a country. There are people who voted Remain, who nonetheless believe that Government should attempt to negotiate a deal to get Britain to leave, but these are dwarfed by the number of remainers who still wish to see Britain either revoke or wish to see a 2nd Referendum (presumably as a vehicle of remaining in the EU).
Of those who support Brexit almost none support the only deal that has been negotiated, and whilst there were more in favour of a deal than leaving without one, there was a significant number who said Britain should be willing to leave without a deal if no ‘better’ deal can be achieved.
Should Britain attempt to remain in Customs Union and Single market?
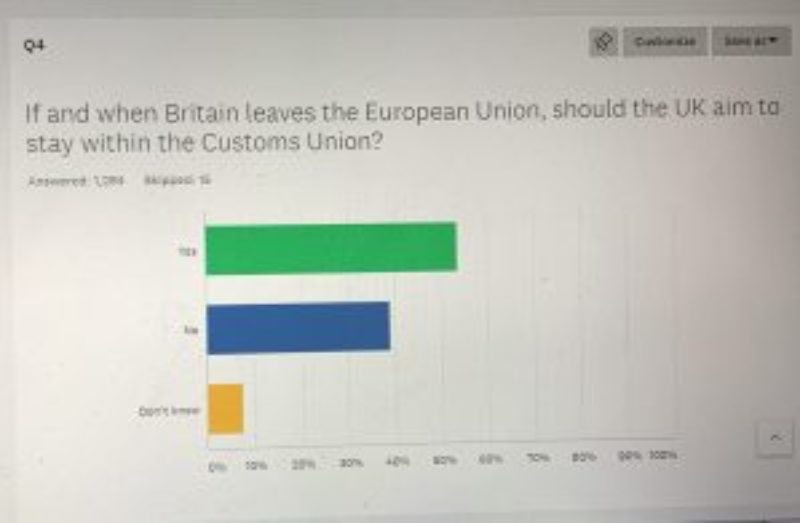
There was a majority in favour of remaining in the customs union and single market, which was greater than the numbers who wished for Britain to remain in the Eu, but only a fairly small percentage of Leave voters wished to see Britain remain in these arrangements.
53.8% supported remaining in the Customs Union and 55.6% for the single market compared with 38.4% against.
Labour’s manifesto for the 2017 General Election said that ‘ Labour believes leaving without a deal is the worst possible option for our economy and that we would seek to retain close alignment with the Customs Union and single market.” Whilst this answer showed a majority in favour of remaining in the customs union and single market, the number of Leave respondents supporting that position showed that for the many Leave voters a Brexit that saw Britain remain in the customs union or single market would not be accepted as a fulfilment of Brexit.
What should happen in Ireland?
Given that the survey respondents were more likely to have voted Remain than Leave, it was maybe unsurprising that the most popular response to the question of Ireland was to continue to have freedom of movement for goods and people (45.39%) than any other. The second most popular answer (22.65%) was ‘there should be no border for people but goods should be subject to customs checks’, 14.72% wanted a ‘border’ in the Irish Sea, whilst returning to a hard border between the North and South and re-negotiating the Good Friday agreement was backed by just 7.3%.
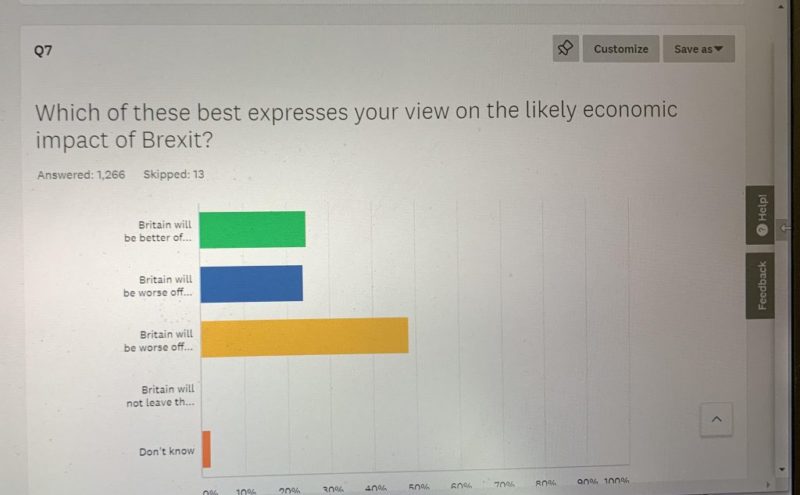
Economic prospects
Almost half of respondents (48.49%) thought the UK would be worse off now and in the future when we left, whilst those who thought Britain would ultimately be better off were split between those who thought we’d be better off immediately and eventually (24.76%) and those that argued that the UK would initially be worse off but ultimately better off (23.81%).
Benefits
There were two free text questions concerning the benefits or concerns regarding Brexit.
The words used most often to describe benefits were: laws, freedom, trade deals and control.
The words used most often to describe concerns were: economy, NHS, trade deals and recession.
Key negotiating priorities
The next question asked respondents to order their key negotiating priorities on a scale of 1-5. There was a list of which answers received the most ‘Number 1 priorities’ and an overall score.
‘Trade with the EU’ was both the most popular Number 1 priority and also the top overall score (3.59), followed by ‘ability to trade with countries outside the EU’ close behind (3.49%), Preserving the United Kingdom union (2.84%), collaboration on security (2.63) and control of immigration (2.51)
A General Election
The question of a General election was one that didn’t go down a purely Leave/ Remain divide.
Remain voters were slightly more likely to think that the PM should call a General Election than Leave voters, although recent events may have changed the response if it was asked again. But overall 49.88% said that we SHOULD have a General Election and 39.87% said that we SHOULD NOT, 10.25% were unsure.
Conclusion
The survey has been immensely useful in getting an updated snapshot of constituent opinions. Every voter in Chesterfield was invited to vote, and no-one was excluded, but that doesn’t mean that the numbers responding were a representative sample.
The most striking conclusion is that currently there seems to be very little sign of the country or the constituency being about to come together. The vast majority of voters still think what they did about the overall question of what we should do, and respondents to this survey seem to be hardening in their view towards a ‘Hard Brexit’ or a ‘Hard Remain’.
Recent elections have also rewarded parties who took a view at the more extreme end of the Brexit debate, with Brexit Party (No deal) and Lib Dem (Parliament to overrule Brexit without a Referendum) benefiting in the recent EU Parliamentary elections whilst both Labour Party and the Conservatives finding Leave and Remain voters were unpersuaded thus far by attempts to find a ‘middle way’.
I can’t pretend that the survey responses have given me a great deal of confidence that we are close to re-uniting the country- particularly whilst so much remains unknown about the basis of our future relationship with both the EU and the rest of the world. One thing that was clear was that the importance of trade and the impact on our economy was now considerably more significant to voters than concerns about immigration.
The complexity of delivering a Brexit that doesn’t undermine the UK union and protects relations on the island of Ireland were also well understood by respondents who were much more inclined to compromise on that question.
In the 2017 General Election, I said that I believed we needed a Brexit deal that delivered on the promises made for it (namely being able to continue to trade and attract world class talent). The support for staying within the single market and customs union at least showed support for that aspect of my approach. I have long said that I believed we could only re-unite the country by finding a resolution that recognised the narrowness of the outcome whilst also accepting that the Referendum result was a vote to Leave. Both I, and the Labour Party manifesto of 2017 made clear our opposition to leaving the EU without a deal. This was consistent with what campaigning organisations like ‘Vote Leave’ and senior Government ministers from the Leave side said during the campaign and since.
I will continue to engage with both constituents and businesses as the process progresses. I hear, loud and clear, people’s frustration about how long the process is taking, but I think there was a deliberate attempt during the campaign and since it to underplay the complexity or full consequences of leaving the EU- particularly in moving on to WTO terms, and leaving without a deal.
I also hope that this survey will have helped others to realise (as I have done) how different the opinions of people who may have voted the same way on 23rd June 2016. Not all leavers are ‘no dealers’, not all remainers are ‘revokers’. But there is still a strong sense that far from bringing the country together and settling the matter once and for all, in many ways opinions are more divided now than they ever were.
It leaves politicians with an unenviable task in finding a way to bring the country together. I have already voted in Parliament in ways that I felt were a compromise, but am renewed in my determination to find a solution that a majority can accept and can help the country come together again.